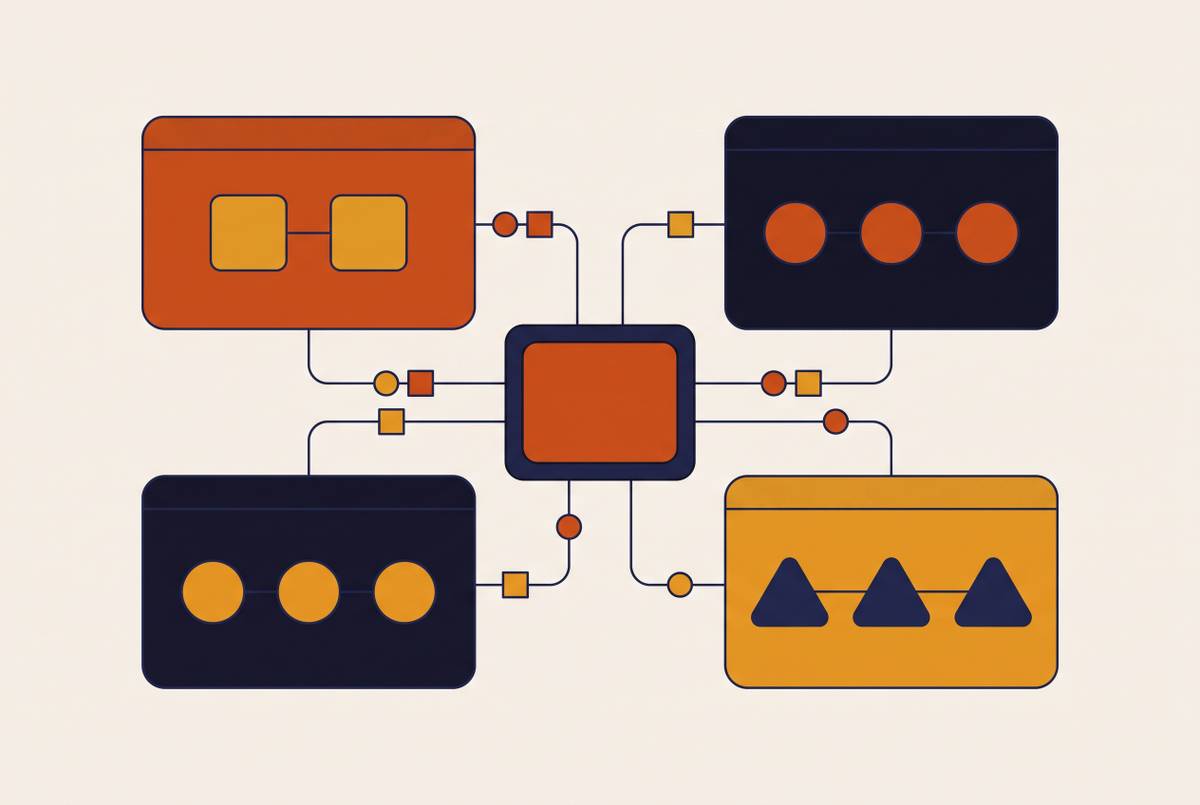
Observability Architecture for Production LLM Traffic
LLM requests demand four separate signal types that standard API monitoring misses entirely.

LLM requests break standard monitoring approaches for a concrete structural reason: they share almost nothing with conventional API calls beyond the HTTP wrapper. A REST endpoint has predictable payload sizes, stable latency distributions, and pricing tied to request volume. An LLM request has none of that. Latency swings by seconds depending on model, prompt length, and streaming behavior. Pricing is denominated in tokens, which bear no fixed relationship to request count. A single agentic session can resend the full conversation history on every turn, compounding token consumption in ways that any per-request view misses entirely. The prompt itself is a security surface carrying PII exposure and prompt injection risks that have no analog in a JSON payload.
This is why observability for LLM traffic has to cover four distinct signal types, each requiring different instrumentation. Cost signals capture token counts at the prompt and completion level, model-specific pricing applied in real time, and per-request spend attributable to a specific team or project. Latency signals require time-to-first-token, total response time, and provider-level variance tracked separately, because those three numbers tell fundamentally different diagnostic stories and collapsing them loses the signal. Error signals include provider failures, timeout patterns, content policy blocks, and routing errors, each categorically distinct even when they surface as the same HTTP status code. Data signals cover PII presence in prompts, policy-rule violations, and prompt anomalies that warrant review.
The problem compounds when teams run multiple providers. A failure in one provider's response looks identical to a routing error unless the instrumentation layer can distinguish them. Teams who defer this instrumentation will rebuild it under pressure, and rebuilding under pressure produces incomplete records, missed incidents, and a lot of very expensive archaeology.
"Complete" looks like a single record per request carrying cost, latency, provider identity, error state, and any data-policy flags, queryable in real time rather than reconstructed from end-of-month invoices. That record doesn't exist if your observability is bolt-on. It only exists if it's captured at the right architectural position.
How a gateway becomes the natural collection point for all four signal types
The gateway's value is positional. It sits in the request path between every application and every provider, which means it sees 100% of traffic regardless of which team sent the request, which application initiated it, or which provider answered it. No other layer has that property, and most of the complexity in LLM observability collapses when you start from that fact.
Native instrumentation at the gateway eliminates the forwarding step, the per-application SDK integration, and the per-provider adapter you would otherwise maintain separately. The signal is captured once, at the proxy, covering the full causal sequence: which model was requested, which was actually used, which provider was tried first, whether a retry or fallback occurred, and what the final result was. Post-hoc log shipping loses that chain. By the time you are reconstructing events from forwarded logs, the sequence is already partially opaque, and partial opacity is exactly the condition that makes incidents expensive to debug.
OpenTelemetry-compatible distributed tracing at the gateway connects a single user-facing request to all of its downstream provider calls, including retries and fallbacks that would otherwise be invisible. For agentic workloads, where a single end-user action triggers a chain of LLM calls, tool invocations, and secondary model calls before a response surfaces, trace propagation from the gateway downward is not a convenience. Without it, you cannot follow that chain at all.
Token accounting at the gateway makes cost attributable by key, team, model, and provider before the invoice arrives. The invoice tells you what you owe; the gateway tells you why, when, and to which team it should be attributed. Those are different questions, and only the gateway can answer the second set in real time.
Request tracing at the gateway: what a complete trace captures and why each field matters
A complete trace is not a log line. It is a structured record with fields that serve specific diagnostic purposes, and the absence of any one of them degrades the record's utility in ways that only become apparent when you actually need to debug something.
The minimum viable set of fields: request ID, timestamp, originating team and key, model requested, model actually used, provider, prompt token count, completion token count, time-to-first-token, total latency, HTTP status, provider error code where applicable, cache hit or miss, and the routing decision applied.
Model-actually-used versus model-requested is the distinction teams most consistently underestimate, often until it costs them. Without it, a cost anomaly caused by a routing rule change is indistinguishable from an application-level bug. If your trace only records what was requested, you have no visibility into what the routing layer actually did, and routing logic is where a surprising number of production surprises originate.
Span-level timing separates provider latency from application latency. A slow response is either the model, the network, or something in your own stack. The trace should say which. Streaming responses complicate this further: time-to-first-token and total response time diverge significantly in streaming scenarios, and both need to be captured as separate fields. A response that starts streaming quickly but takes a long time to complete has a very different quality profile than one with a long initial delay — like a waiter who takes your order immediately but disappears into the kitchen for an hour. Collapsing them into a single duration field conceals that difference and leaves you with a number that explains nothing.
Distributed trace context at the gateway level lets an engineer follow a single end-user action through the LLM call, any tool invocations, and the final response. For agentic workflows, debugging a multi-step failure without this requires manually correlating events across systems that were never designed to speak to each other. I have done that. It is miserable, and it takes far longer than the incident warrants.
Cache hit and miss in the trace record makes semantic caching auditable. Teams can see what fraction of traffic was served from cache, validate that cached responses remain appropriate over time, and quantify cost savings with actual data rather than estimates.
Token accounting as a real-time cost layer, not a billing reconciliation exercise
SpendHound's 2026 AI Spend Report found that 46% of finance and procurement leaders exceeded their AI budget in 2025, compared to 37% who overspent on traditional software. Run-rate spend across major providers grew nearly fourfold between December 2024 and December 2025, per the same report. These are not anomalies. They are what happens when consumption is structurally invisible until the bill arrives.
The clearest illustration of the structural mechanism: Uber gave 5,000 engineers access to Claude Code in December 2025, and the entire annual AI budget was exhausted by April 2026, according to publicly reported accounts. Agentic workflows resend full conversation history on every turn, and token consumption compounds per session. What looks like a modest feature deployment can generate millions of tokens in minutes. Without a real-time accounting layer, there is no signal until the invoice arrives — and by then the question is no longer how to prevent the overrun, only how to explain it. You could say the budget didn't just run out; it ran out and kept running.
Token accounting at the gateway resolves this by making cost attributable by key, team, model, and provider before the bill arrives. Budget alerts fire at a specific consumption threshold. That distinction matters more than it sounds: receiving an alert when you have consumed a defined amount is a managed system; discovering the overrun during a finance review is a preventable failure.
Model selection is a meaningful cost lever that remains invisible without model-level attribution. Per Ramp benchmark data from April 2026, premium models represented 45.8% of tokens consumed by businesses but 55.9% of total cost. The differential exists because premium models are more expensive per token, not because they are being used more frequently. If your accounting layer aggregates across models, that shift is invisible, and invisible cost drivers are the ones that reliably produce end-of-quarter surprises.
One structural caveat worth naming explicitly: per-token platform fees layered on top of provider pricing erode the value of real-time accounting. If the gateway is marking up the token cost before reporting it, you are not seeing provider rates. You are seeing a proxy figure that does not reflect your actual spend. The gateway should report raw provider token costs, and the accounting layer should be transparent about what it is measuring.
The routing logic and the real-time token counter must occupy the same layer for policy enforcement to function as a cost control. Capping a specific model to a percentage of requests, or enforcing a cheaper model for defined task types, only works if the system can simultaneously observe current consumption and execute a routing decision against it. Separate those two capabilities and you introduce either a latency problem or a consistency problem in enforcement, sometimes both.
Provider health monitoring and what fallback logic requires to work correctly
No single provider maintains 100% uptime. In a multi-provider architecture, the gateway detects degradation and executes fallback before the application surfaces an error to users. The application layer should not be making those decisions; it does not have the visibility to make them well.
The health signals the gateway needs per provider are specific: error rate over a rolling window, p50, p95, and p99 latency, rate-limit response frequency, and a distinction between transient and sustained errors. A single 429 looks very different from a sustained pattern of 429s across a five-minute window. The operational response to each should differ accordingly, and conflating them produces the wrong reaction at exactly the wrong moment.
Passive health checks, observing errors on live traffic, are lower overhead and always running. Active health checks, synthetic requests at defined intervals, catch degradation before live traffic encounters it. Production systems benefit from both, because passive detection has a lag that active probing eliminates.
Fallback chains need to be intentional and visible in the trace record. Which provider was primary, which was the fallback, and whether the fallback was invoked: all of that should appear in the request record, not just the final response. Opaque automatic routing that switches providers silently is a visibility problem, not a reliability feature. Teams need to know a fallback fired, to which model, and whether that model has been approved for the data type in the request.
Rate-limit events deserve their own category in the health dashboard, separate from errors. A 429 is a signal to shed load or queue, not to retry immediately. Surfacing them separately lets teams distinguish provider saturation from provider failure in real time.
Agentic workloads amplify the cost of an undetected fallback significantly. A multi-step agent that silently switches to a weaker model mid-task produces structurally valid but semantically incorrect outputs that propagate downstream through the rest of the task before anyone notices. By the time the error surfaces, the causal chain is obscured, and the fallback event that was the actual origin of the problem is invisible in the logs. That is the failure mode that haunts production agentic systems, and correct instrumentation prevents it entirely.
PII visibility and data-policy enforcement as an observability layer, not an afterthought
Cyberhaven's 2026 AI Adoption and Risk Report found that 39.7% of all enterprise AI interactions involve sensitive data, and 58.2% of Claude interactions flow through unmanaged personal accounts that bypass corporate controls entirely. Sit with that second number for a moment. More than half of Claude interactions in enterprise environments are happening outside any corporate visibility at all. The compliance exposure that creates is not theoretical; it is already accumulating.
Default provider retention policies create quiet liability that most teams are not tracking explicitly. OpenAI retains API data for 30 days by default; zero-data-retention requires a negotiated enterprise agreement unavailable on standard pay-as-you-go plans. Teams sending sensitive data to providers without understanding the retention terms are accruing compliance liability invisibly, which is the hardest kind to remediate because you often don't know the scope until someone asks.
PII redaction at the gateway layer, before the prompt reaches any provider, is the only architectural position that enforces policy regardless of which application sent the request or which provider receives it. Application-level redaction requires every application to implement it correctly, a coordination problem at scale that consistently produces gaps. Gateway-level redaction has no such dependency.
Redaction must be reviewable to be trustworthy. A system that strips PII silently gives compliance teams no way to audit whether the policy fired correctly, on what entity types, or whether the redacted prompt still produced a useful response. An audit trail that says "request sent" is not an audit trail. It is a timestamp.
HIPAA-compliant architecture for PHI requires, at minimum, a signed BAA with each PHI-touching provider, contractual data-use and retention restrictions on those providers, and encryption in transit and at rest. The gateway is the layer that enforces routing rules preventing PHI from reaching non-BAA providers. Without that enforcement point, compliance depends on application developers knowing which providers have signed BAAs. That is a knowledge management problem masquerading as an architecture problem, and it fails in exactly the way knowledge management problems fail: gradually, then all at once.
RBAC at the gateway level controls which teams can access which models and providers, and the access control layer and the observability layer need to be the same system. An audit log entry only carries full meaning when it captures both what happened and who was authorized to do it. Separating those systems means your audit trail requires a join operation to reconstruct, which is slow during an incident and unreliable at scale.
What the unified observability record looks like across all four signal types
The argument for a single record is diagnostic, not philosophical. Debugging a production incident requires correlating "this request was expensive" with "this provider was degraded" with "this prompt contained PII." If those signals live in separate systems, the correlation happens manually, slowly, or not at all. The incident resolves later than it should, at higher cost, with less confidence in root cause.
A complete request record at the gateway carries: trace ID, key and team identity, model requested, model used, provider, prompt token count, completion token count, total token count, cost at provider rates, time-to-first-token, total latency, error status, HTTP status, cache state, routing rule applied, whether a fallback was triggered and to what, PII entity types detected, whether redaction was applied, and which policy rules fired.
Queryable in real time means something specific. An engineer can filter to all requests over a defined cost threshold in the last hour that also triggered a fallback, without exporting to a separate analytics tool. A compliance officer can pull all requests where PII was detected and the destination provider lacked a BAA, in real time, from the same interface. A finance lead can view cost aggregated by team and model for the current month, updating continuously. Each of those is a different question against the same underlying record.
Granularity requirements differ by stakeholder, but one underlying record can serve all of them. Engineers need trace-level detail. Finance needs cost aggregated by team and model. Security needs a policy-violation feed. Engineering leadership needs a cost-versus-quality dashboard. Each view is a projection of the same data, which keeps the governance model simple: one source of truth, multiple access patterns.
The alternative, each team running its own logging, finance reconstructing spend from invoices, security reviewing provider dashboards in isolation, produces the fragmentation that lets budget overruns and data exposures go undetected until they are already large. That is the default outcome when observability is deferred, and it is entirely predictable.
How observability data feeds routing, budgeting, and compliance decisions in an ongoing loop
The reason to call this a control plane rather than a monitoring layer is that the data it produces is meant to change behavior, not just record it. A router applying static rules set at configuration time degrades as traffic patterns evolve. A router using historical latency and error rates per provider adapts continuously, and that adaptability is the difference between a routing layer that stays accurate and one that quietly drifts while you assume it is fine.
RouteLLM's ICLR 2025 results illustrate the principle directly. A matrix factorization router trained on historical quality signals achieved 95% of GPT-4 performance using only 14% GPT-4 calls, with data augmentation, on MT-Bench. MT-Bench covers conversational tasks rather than structured agent outputs, so its applicability to your specific workload will vary. The underlying principle, however, holds broadly: observed performance data produces better routing decisions than static configuration, and that gap widens as traffic volume and model diversity increase.
Budget alerts work as a control loop only when real-time token accounting enables threshold-based enforcement. A team approaching its monthly model budget receives an alert, and a policy can throttle or reroute automatically rather than waiting for a finance review to surface the overrun. That feedback loop requires latency measured in seconds. The only architecture that achieves it has the token counter and the routing logic in the same layer.
Compliance feedback is operational, not archival. A spike in PII detections for a specific team or workflow is a signal to review the prompt templates feeding that workflow. Treating it as an archive entry means the spike recurs. Treating it as an operational signal means someone investigates the source, the problem shrinks, and you have a record of the investigation when the auditor asks.
Provider health data feeds SLA planning with real numbers. Observed p95 latency and error rates by provider, accumulated over weeks, give engineering leaders actual data to set user-facing latency budgets and decide when a fallback chain needs reconfiguration. Those decisions, made without this data, are guesses dressed up as engineering judgment.
Every operational decision, where to route, how much to spend, what data to allow through, improves when grounded in a continuous unified signal from the gateway rather than reconstructed from disconnected sources after the fact. At the traffic volumes production LLM infrastructure now operates at, this is the architecture that works.